This post is inspired by an external blog article that supports the main premise of the hamster wheel economy, and through debt analysis provides an incomplete picture for our nearing the sustainability limits on our debt levels.
Part of the reason its an imcomplete picture, is that debt to GDP levels do not matter directly. Only debt to net worth levels matter, though there is a distant relationship. This is yet another roundabout way to justify unconditional basic income policies as we will see later. But, first let's look at basic accounting, economic and finance principles.
The 4 indirect components of GDP
Raw materials, energy, labour and profit make up all the costs of every product, and so all of the income of everyone.
Energy wealth
The cost of energy directly affects the wealth of landowners that own oil and gas deposits. Solar and wind energy are special in that they convert uncombustible materials into non-contentious (no premise for war) energy. An interesting side note is the mid 19 century whale oil boom that appears to justify/mirror motives for current planetary destruction.
Lower energy costs results in lower GDP and lower total wealth.
Raw material wealth
The cost of food, lumber, and minerals is direct wealth to everyone that owns the land where those materials come from. Lower energy costs tend to facilitate extraction of raw materials, lowering their costs, and increasing profitability if raw and processed materials keep their sales value. Competition in these sectors though tends to lower sales prices to reflect lower extraction costs.
Lower raw and processed material costs results in lower GDP and lower total wealth.
Technological wealth
This is highly intangible and rarely effectively transferable. It is fundamentally knowledge. When cell phone technology reduces the costs and spending for telecommunications over the last 20 years it reduces GDP. But when it permits telecommuncations in the third world, where wired communications networks were a capital impossibility, it increases GDP. Decentralized energy technologies such as small scale solar and wind also have this feature of permitting energification of areas that could not otherwise afford them.
Where technology is used to decrease costs then it decreases GDP. If we all had flying cars, and 100" TVs/monitors then there might be an increase in GDP.
Real estate wealth
Commercial and residential to distinguish it from commodity/energy land holdings. This is mostly a function of affordability: The sum of all other wealth, and debt ease/interest costs. Highly influenced by political/fiscal and monetary policy.
Financial wealth
Cash, stocks, but also debt (bonds) that is owned as the other side of creditor debt owed. For stocks and debt, highly influenced by monetary policy, and monetary inflows (or outflows) into financial wealth instruments.
Commodity, real estate, and financial wealth is all that counts
cars, furniture, collectibles is all 2nd hand economy stuff for scavengers to fight over, and rightly considered irrelevant.
Precarious monetary policy
Lowering interest rates and printing money through QE or other means directly increases the value of bonds, and improves the affordability of housing. It increases the appetite for debt and inflates all financial and real estate prices and wealth.
The problem is that this inflation is only sustained with continued policy. The higher debt levels associated with the inflation present a fundamental danger that "forbids" discontinuing the easy money policy. A home worth $200k on an affordability basis at 2.5% interest mortgage is worth $100k if interest rates adjust to 5%.
A magic debt to net worth ratio of 50%
Because net worth includes debt owed by others, a debt to net worth ratio of 50% is equivalent to a debt to (net worth less debt) ratio of 100% (for an economy-wide or global analysis). The crossover point is inherently crossing a fragile equilibrium, since the value of debt depends on the value of assets. At over 50% debt to net worth, there is a statistical probability of someone owning the wrong debt, and then someone else owning their debt.
Its true that the real bankruptcy point occurs at debt to networth levels of 100% or more, but the fragility of the 50% level is that it is easy to degenerate into an asset deflation and bankruptcy spiral that quickly goes to 100%.
charts and graphs
table 1 (page 5) in http://economics.uwo.ca/people/davies_docs/credit-suisse-global-wealth-report-2014.pdf shows that the wealth in EU, NA and China is $198T for 2014.
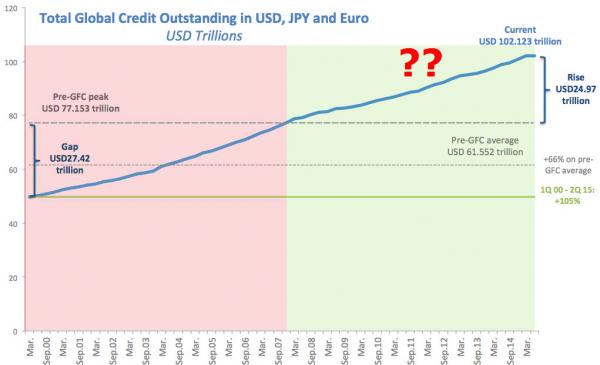
while debt in those 3 countries increased to $102T. This is over the 50% fragile level. China's household debt alone grew by over 16%. A faster rate than its net worth increase.
The debt to net worth ratio hasn't changed that much since 2000
Because net worth has been rising by about the same rate. However, the net worth increase components are fragile:
- Lower interest rates compared to 2000 mean that bonds obtained a 20% to 30% increased return and value. Those profits then chased other asset values.
- QE in the US and EU boosted bond values another 10%, and in fact reduced debt by retriring it onto central bank balance sheets. Debt levels managed to still increase despite several $trillion of debt being eliminated by these programs.
- Housing is worth double what it was in 2000 not because of middle class income prosperity, but purely from mortgage affordability benefits of halved interest rates.
- Stocks that might pay dividends are worth more because bonds pay very little now. And profits from bonds must chase their price up.
- Stocks that will never pay dividends are worth more because of momentum from previous pumpings up, and so attract more money flows.
- Commodity inflation during that period provided a use/sink for debt.
- Chinese unsustainable debt-fueled overexpansion provided a use/sink for the commodities.
Profits resulting from gifts of monetary policy, pleasant as they may be, are gifts that may be undeserved, but more importantly, are not sustainably permanent, or permanent only if easy monetary policy is forced to be permanent.
Relationship of Debt to GDP
While I started this essay saying debt to GDP was indirect/irrelevant, I quickly pointed out GDP accounting relationships to assets. Financial and real estate assets create negligeable if any contribution to GDP. (New home production, home improvements, and product capacity increases excepted). A computer (or other technological asset) that allows a company to process its accounting with 1 person instead of 10 causes a decrease in GDP.
The only debt that increases GDP is debt that finances commodity and materials processing and production increases. The main reason for rapidly increasing debt to GDP ratios is that a very small portion of debt and investment in the past decade has been used to finance growth, and instead most of it has been used to inflate passive assets, and provide cost cutting technology.
How a commodity wealth domino is large enough to topple the rest
Debt used other than financing the commodity sector has little if any contribution to GDP. Commodity deflation also directly causes a reduction in GDP: lower prices throughout the economy. The 75% or so reduction in commodity based wealth in the last 16 months is going to affect the debt holders. Commodity related bankruptcies may not bring down financial institutions, but it will curtail the credit they make available, and so affect housing and financial assets.
The likely policy response is more financial bailouts to continue financial and housing asset inflation. More debt and more money inflating non-(GDP)-productive assets will seem necessary, after some hand wringing.
Without intervention the commodity deflation could cause a 20% to 30% drop in world assets, as a result of credit crunches. The response of inflating non-productive-assets as has been done the last 9 years will mitigate the drop, but still grow debt subtantially without growing GDP or a net increase in asset values, all the while requiring continued asset-inflation-monetary-policy to prevent a collapse in non productive assets.
Its actually difficult for monetary policy to save the commodity and materials sectors. It will save the banks, but business, financial and household assets are all likely to take significant hits, and lead to deflation of everything else as a result of wealth supply (global net worth) contraction.
Race to the bottom currency deflation war solution
Interest rates can absolutely not be raised as this paper, and the Hamster wheel economy showed. Currency deflation can increase nominal GDP while devaluing debt. It also permits asset inflation. The same influence that assured banking system loyalty for QE, can assure banking system cooperation during the currency devaluation. Its the best banking bailout from an overindebted citizen perspective because it simply assures bank solvency rather than socializing losses. Its still a defeatist path.
Bernie Sanders Fiscal policy and taxation of high incomes solution
is the generally appropriate path. Will increase GDP and increase assets related to production growth that captures increased GDP, and so better use any debt. However, other than universal healthcare, drug legalization, and carbon tax and dividend, every fiscal proposal by Bernie Sanders is stupidly innefficient and unfair: Creates politicized winners and union job lotteries.
Unconditional Basic Income as the ideal fiscal policy
UBI (providing an equal cash dividend to all citizens) whether paid for by fiscal or monetary policy is the best fiscal stimulus policy that simultaneously reduces government, and the politicization of economic winners. UBI solves poverty without bureaucracy or favoritism, by assuring every citizen has enough money to not be poor.
More importantly, and relevant to this essay, UBI also saves banks by permitting affordability of housing assets, and reducing the risk premium of loans made to consumer sector. Consumer demand driven inflation of assets is an inherently real source of value for assets and so allows them to catch up in value to the monetary-inflation-based-puffing-up of the last decade. UBI provides people with the freedom to contribute to society the best way they please, and at less risk than non-UBI alternatives. An expectation of increased competitiveness and productivity and innovation is absolute as a result of UBI.
UBI is a wealth driving, as opposed to an unsustainable wealth-propping-up, policy. Poor wealth to debt or GDP performance in the last 14 years is fundamentally the result of the lack of attractive investable production projects.
The difference with 2007
Global Household real assets (95% residential property) in 2014 reached the same level as 2007 values. Financial assets (compaines and debt/bonds) reached about 10% higher than the 2007 peak. (figure 4 page 16 of credit suisse report). Global household financial wealth is 10% higher than global real wealth.
Those asset levels reflect near 0 interest rates, and the peak of a commodity boom. 2007 had similar commodity levels, but not the interest rate environment.
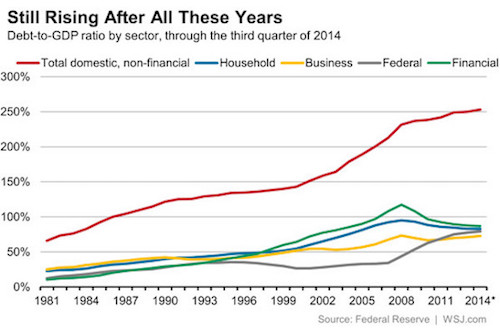
This is roughly a 5% global asset increase since 2007 accompanied with a 32% increase in debt (in just the 3 largest markets). The aggressive stimulus policies that bumped us up slightly from pre-financial crisis levels, theoretically limit the aggressiveness capacity of future stimuluses. Sovereign debt (owned mostly by financial institutions, but likely excluded in above chart's financial debt component, and so indirectly held by households) had the biggest increase since 2007 going from 30% to 80% of GDP.
There was a fairly sharp rise in business, household and financial debt to GDP in 2007, but it accompanied a nearly equal rise in net assets and net worth, and prime rates were above 7%. Perhaps the 2008 crisis was caused by overall debt levels, but it definitely was caused by specific household debt. A sharp drop in asset values is equivalent to a sharper rise in debt levels, and likely to uncover corrupt financial debt schemes again.
The impact of a 20% drop in financial assets from 2014 levels is a 12% drop in total global assets. The reserve system prevents banks from selling sovereign debt if they have to raise cash, but it will stop them from buying more (affecting capacity for new sovereign debt), and will constrain credit to other sources. GDP contraction further contracts asset values. Bank insolvencies contracts GDP and asset values. This all indirectly leads to lower home values and further GDP contraction.
The world is in a much tighter corner than it was in to dig out of 2008 problems. Arguably they never did. The structural productivity shift and necessity to raise taxes to allow innovation to provide for markets has been fought against rather than embraced. UBI is a release from the corruption of kings, and provides the necessary decentralization to create innovation and the next tiers of demand based productive wealth.